
By Judie Steeves – Staff Reporter (Capital News, Kelowna, British Columbia)
By recording information that’s beyond the visible spectrum about streams, watersheds and heat escapement from buildings, it’s possible to pinpoint where there are problems so they can be corrected.
Infrared thermal imaging is not new technology, but Curtis Bennett’s application of it, and his ability to interpret it, is.
Using thermographs, Bennett says he can save time, energy, lives and money.
He admits quite frankly he’s fascinated about the technology.
He has recently completed training as an engineering technologist, to add to his training as a certified electrician and a thermographer or heat specialist.
His assistant in his Kelowna-based company called Thermografix, is experienced in carpentry and construction and agriculture.
Doing thermographs of a complex manufacturing facility or a residence can help pinpoint heat losses, perhaps where insulation is missing or damaged; or hot areas where friction is occurring or there are electrical problems.
Often they’re areas missed by regular building inspections.
Doing thermographs of creeks or watersheds can indicate where riparian planting would help reduce the heating of adjacent water for healthier fish habitat, or where it’s already been done as required.
It can also indicate where fish may be adversely impacted by temperatures.
Understanding the effects of solar gain on specific areas, how it becomes a heat source for the area, adjacent water or atmosphere is vital to proper interpretation of thermographs, Bennett says.
It’s important to understand that heat often dissipates for a long time after sundown.
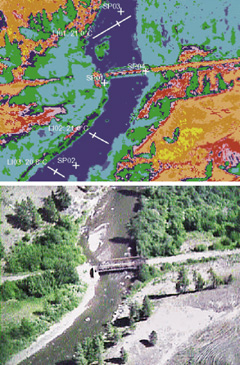
Bennett has done some work for Henderson Environmental Consulting of Kelowna mapping streams this year and forest hydrologist Greg Henderson sees many potential applications for the technology.
But first, Henderson carried out a test to ensure the technology was accurate by comparing Bennett’s temperature mapping from a helicopter, with water temperatures taken on the ground using a certified thermometer.
The result: it was within .4 of a degree.
The resulting thermographs dramatically show the impact of vegetation in reducing ground temperatures and that of adjacent streams.
It has the advantage of speed and of being archived for continual future reference.
Henderson believes it could also be used for tracing plumes of contamination in water courses, for detecting groundwater springs and other inflow sources.
It’s possible the technology would also be helpful in detecting attacks by pine beetles before they’re visible to the eye, in counting deer, moose and other animals, and in detecting toxic spills and when cleanup has been completed.
“It has opened the eyes of some companies,” Henderson says.
Collecting the data is pretty straightforward, but interpreting it is critical as everything has a thermal signature, he emphasizes.
Such data can easily be mis-interpreted. That’s why, for instance, Bennett insists on taking thermographs of both the inside and outside of a building.
Bennett hastens to add it’s not his intention to be critical of other methods of monitoring or doing inspections, but he says some of them are obsolete compared to thermography.
In the process of using it for different applications, Bennett has unearthed some more serious concerns about the amount of heat loss and waste that’s incurred because of poor construction and about the validity of some building code regulations.
For instance, he made recommendations to former premier Dave Barrett’s commission on the leaky condo fiasco after discovering that many of the vents for dryers in suites didn’t vent directly outside the building, and didn’t use the manufacturer’s recommended venting material.
A gallon of water is dried from a load of laundry, estimates Bennett, and it must be properly vented outside or it will cause the building to deteriorate and potentially fatal molds to grow inside buildings.
He believes every building should be scanned thermally to detect such problems.
Sharing the information he has amassed is another passion of Bennett’s, and he’s willing to speak to industry, groups or individuals interested in learning more about the technology.
jsteeves@kelownacapnews.com